Sample Views and Standard Reports
The Information Center provides endless ways to filter, sort, compare and view data. The following are sample views and standard reports for demonstration of the type of information that may be accessed for analysis and reporting.
Views
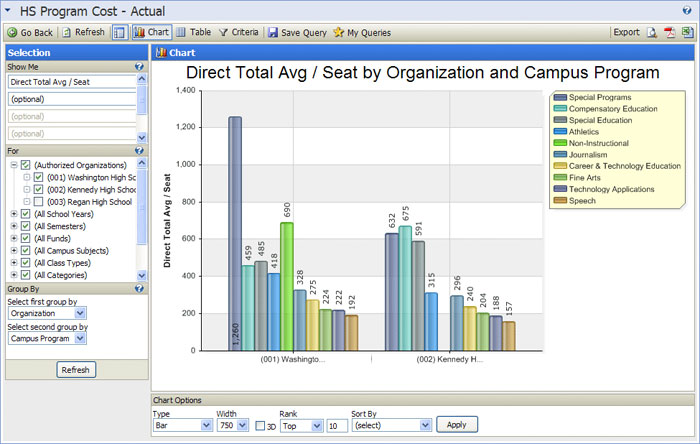
This screen displays a chart showing the Average Cost Per Seat (direct costs only) by campus program for two campuses.
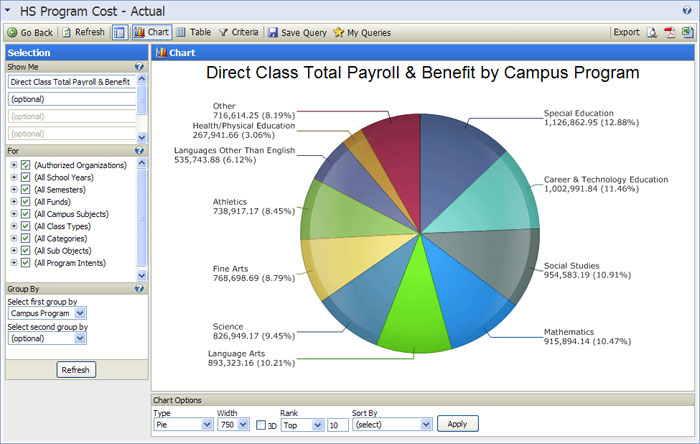
This screen displays a chart showing the Direct Payroll & Benefits costs allocated to Classes and summarized by Campus Program.
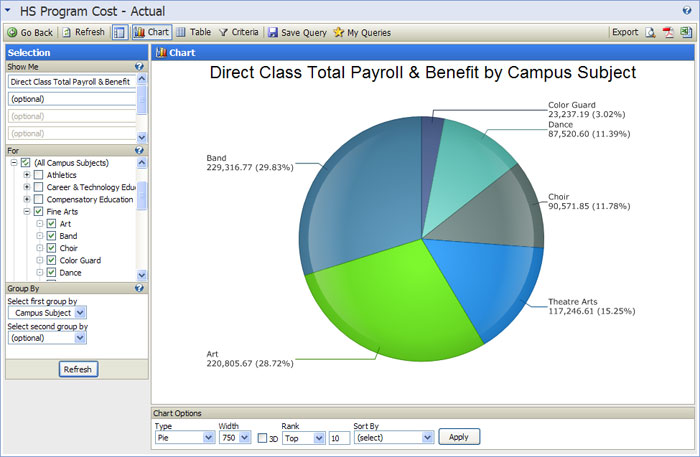
This screen displays a chart showing the Direct Payroll & Benefits costs allocated to Classes and summarized by Subject. This is an example and result of a drill down on Fine Arts from previous screen.
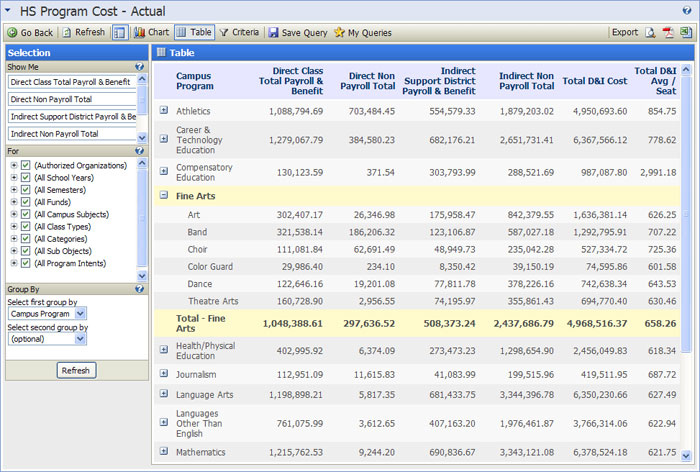
This screen demonstrates a table view with Direct and Indirect Costs by Campus Program and associated Average Cost per Seat. It also demonstrates a drill down on Fine Arts.
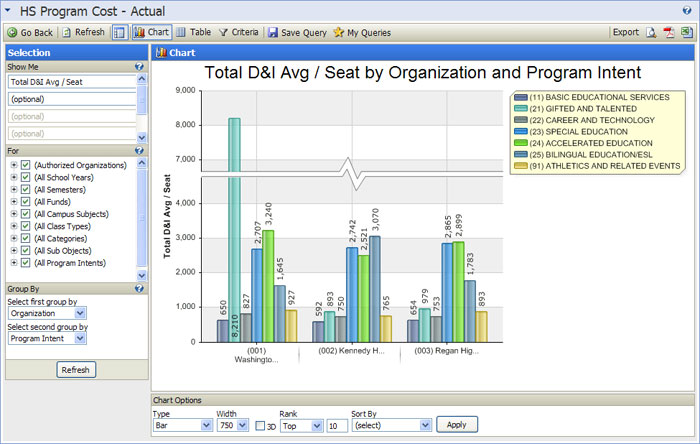
This screen displays a chart showing the Total Average Cost per Seat by Program Intent for three Campuses using Total Direct and Indirect Costs.
Standard Reports
The following are sample Standard Reports of Program costs available through the Information Center. There are currently over 100 standard reports with varying levels of summary and detail information.
Direct and Indirect Cost Summary by Campus and Program for Basic Education offering (Program Intent)

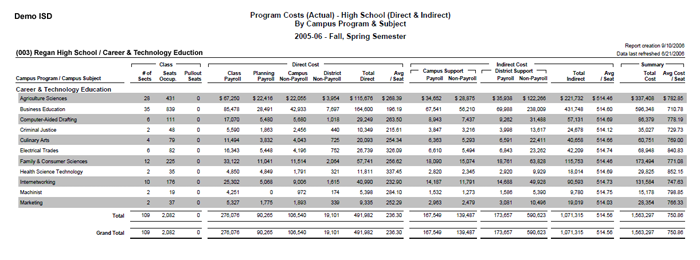
Direct and Indirect Cost Summary by Subject for Career & Technology Education (Program Intent)
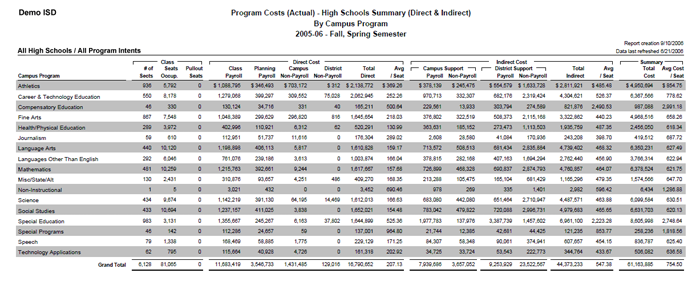
Direct and Indirect Cost Summary by Campus Program for all Program Intents
Contact us for more information or to schedule an appointment to discuss how we can help you today!
